Summary
Diligent seismic acquisition planning always involves careful modelling of field parameters that maximize subsurface resolution and minimize program costs. Traditionally, finding the balance between these two outcomes has been challenging but progressively achievable with skilled field management/crews, simultaneous source techniques (Crook et. al., 2019), and new recording technologies. As industry progresses and the lasting footprints of our work are better understood, our geophysical diligence has expanded to include the people and ecosystems our seismic programs impact. Additionally, full cycle economics become glaringly unsustainable if future costs of reclamation are included in seismic acquisition program costs.
New technologies such as miniaturized source and receiver technologies and innovative cutting techniques are providing encouraging results, but the next exciting step towards ecologically intelligent seismic surveys has started to emerge in the world of program design. As presented in this paper, the focus of these new designs is on maximizing subsurface resolution while minimizing the surface footprint (Fig. 1). New acquisition designs are easier to create than to test. Yes, model attributes and synthetic data can be leveraged to understand the outcomes but confirming how they respond in the real world is a critical validation step. This talk will focus on processing, interpretation, and inversion tests of an existing ultra-high density oilsands seismic dataset decimated based on ecologically improved program designs. Follow along as we measure and compare the results to understand how much farther seismic footprints can be reduced to improve future environmental performance.
Introduction
Seismic exploration for oil and gas in the Canadian boreal forest requires the clearing of trees along seismic lines to provide safe access for equipment deployment. The resulting footprint can result in cutting 10-25% of the total program area depending on the distribution pattern of the seismic cut-lines. Seismic line clearing is typically done in an orthogonal pattern generating interconnected pathways, increasing forest fragmentation, which negatively affects sensitive species such as woodland caribou. Seismic data acquisition activity can also result in soil compaction and a higher water table, leading to elevated methane emissions (Strack et al. 2019). Many cleantech challenges have been initiated by industry to solve these problems, including the 2017 COSIA Land Challenge, the 2020 Imperial Challenge – CleanTech Alliance, 2021 COSIAForesight-Alberta Innovates Reducing Seismic Exploration Footprint challenge, and the recent CRIN Reducing Land Footprint Competition.
Proposed changes to seismic regulations, restricting line widths and the need to reduce seismic acquisition land footprint, requires a new approach to acquiring seismic data. Some of the solutions that have been proposed to address these problems include minimizing cutting by flying GeoConvention 2022 2 equipment in with a helicopter, utilizing alternative sampling theorems to reduce the amount of equipment needed, and miniaturizing seismic equipment (energy sources and/or receivers). Individually, these solutions can provide benefits such as reduced line widths and less overall cutting of the boreal forest, but habitat fragmentation due to interconnected seismic lines remains a problem. By moving to linear type geometries, the land footprint associated with seismic can be reduced, but additional processing may be required.
Method
In this study, conventional and new geometries (linear, alternative, EcoSeis™) were generated from a well-sampled existing seismic dataset via decimation. Decimation involves removing stations/lines from the original geometry definition. Datasets can be decimated in a regular pattern (removing every second, third, etc. station or line) or in an irregular pattern to create more randomization. In seismic, we typically try to sample the seismic wavefield with at least two samples per wavelength (Nyquist sampling) and would ideally have the same sampling distance in all directions (i.e., receiver station = source station = receiver line = source line interval). When data is decimated to reduce environmental impact and/or cost, then the data must be reconstructed using appropriate seismic data processing algorithms. This is typically done via an interpolation algorithm. However, there are limits on how far a dataset can be decimated before the subsurface image is negatively affected (i.e., the geoscientist can no longer identify important subtle subsurface features). Typically, interpolation of seismic datasets results in a 4x increase in trace density. Larger increases (8x, 16x) can be applied, but results become less accurate when large interpolation factors are used on complex datasets (multiple dips, lower signal-to-noise).
The study began with processing the well-sampled (grid) seismic data volume through AVOcompliant pre-stack time migration. Then, cost-effective pseudo-decimation interpolation tests were conducted. From these tests, the best performing geometries were selected for more expensive processing tests where the decimation was applied to raw shots instead of processed, pre-interpolation data. By approaching the testing in this manner, numerous geometries could be quickly evaluated in a cost-effective manner. In total, twelve geometries were tested through the pseudo-decimation processing tests with four geometries plus the input dataset processed through full processing from raw shots.
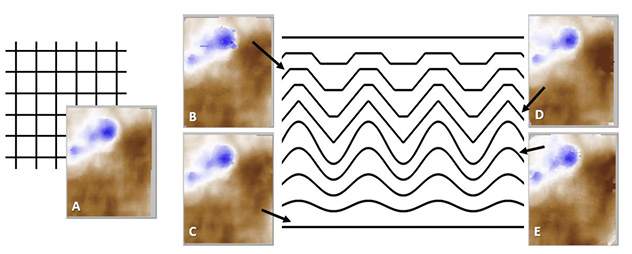
Figure 1 illustrates the comparison between a conventional orthogonal geometry (A) and four linear type geometries – one with straight lines in the form of a conventional Mega-bin geometry (C) (Goodway & Ragan, 1996) and three alternative EcoSeis™ linear-type geometries.
Results
Based on the positive results of the preliminary processing tests, three of the geometries shown in Figure 1 (A, D, and E) were taken through AVO-compliant processing from raw shots in order to accurately compare the geometries as if they had been acquired this way in the field. Table 1 shows the reduction in trace density, linear km of cut-lines, and total area cut (measured in Hectares) as compared to the orthogonal geometry A. Although both geometries have a similar reduction in land footprint (linear km and hectares cut) and associated cost savings related to less line clearing, geometry E also has a 45% reduction in trace density resulting in significant cost savings from the need for less equipment in the field.The linear km reduction is independent of the source type utilized, but the reduction in total hectares cut varies with source type. In this case, the calculations were completed using a 2.75 m wide conventional source cut line and a 1.75m wide miniaturized source cut line and 39-62% reductions in total area cut are achieved. In comparison, if the orthogonal geometry was acquired with miniaturized sources, there would be no reduction in linear km of cut-lines and there would only be a 22% reduction in total hectares cut.
Time slice and NRMS comparisons between the input dataset, the conventional orthogonal geometry, and the two EcoSeis™ linear-type geometries is shown in Figure 2. Although good results are obtained with both alternative geometries, higher trace density results in better resolution and less NRMS variation.
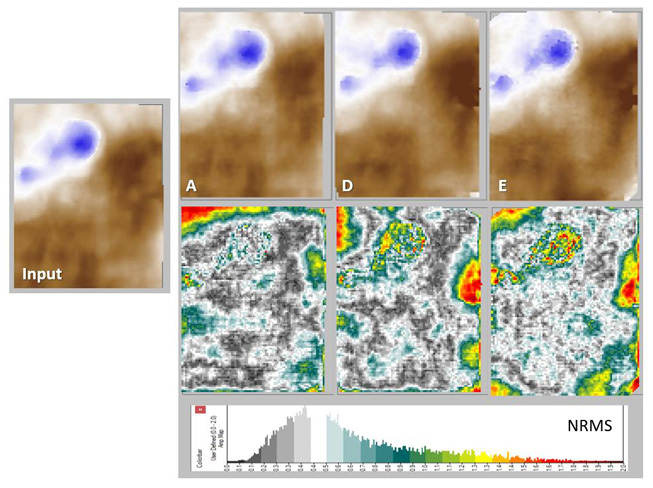
Figure 2: AVOcompliant processing results comparing the input dataset with the conventional orthogonal geometry A and two EcoSeis™ linear-type geometries. Top Row : Time slice, Bottom Row : NRMS between the Input dataset and the three geometries.
Conclusions
Linear geometries such as the EcoSeis™ geometries illustrated in this case study can new way to acquire seismic data with up to a 40provide a 62% reduction in land footprint (depending on the method of implementation) fragmentation occurs. . By utilizing lineartype geometries, less connectivity and forest However, trace density requirements related to accurate subsurface imaging need to be considered, particularly for datasets requiring AVOand prestac k analyses.
Acknowledgements
The authors would like to acknowledge Cenovus for use of the real seismic datasets for this research, Key Seismic Solutions Ltd. for processing 3D datasets, and Alberta Innovates, NRC IRAP, and other project References collaborators for research funding contributions.References
Crook, A., 2019, Simultaneous Source vs. Regular Vibroseis Goodway, W. & A Direct Comparison. GeoConvention Abstracts.
Ragan, B., inventors, PanCanadian Petroleum Limited, owner, Canada Patent 2176058, 1996.
Strack, M., et. al., 2019, Petroleum exploration increases methane emissions from northern peatlands. Nature Communications, 10:2804.