By Mostafa Naghizadeh, Andrea Crook, P.Geoph., and Shane Bossaer
Summary
The horizontal resolution of seismic surveys is determined by the Fresnel zone analysis (Sheriff, 1980). The concept of the Fresnel zone can also be utilized at the design stage of the seismic surveys for optimal positioning of shots and receivers based on the importance of subsurface targets. During field deployment, sources and receivers might need to be shifted/omitted based on surface exclusions and environmental considerations. Seismic acquisition attributes such as fold, azimuth coverage, trace density, mid-point distributions have been utilized to find optimal infill source and receiver stations that can effectively mitigate the seismic array gaps and irregularities (Millis and Crook, 2012; Millis and Crook, 2013; Millis et al., 2014; Crook, 2016). Here, we propose a Fresnel zone-based approach for finding the optimal infill stations for 3D seismic surveys.Seismic acquisition design based on Fresnel zone binning
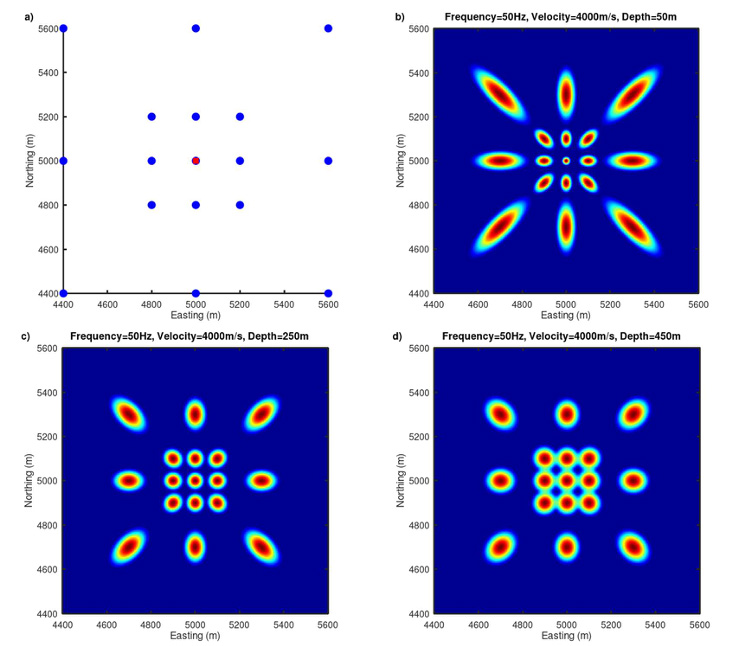
The Fresnel zone formulation for a limited-offset seismic ray was derived by Monk (2010). One can also incorporate the trace energy migration into the Fresnel zone analysis using a Gaussian weight function with a peak value at the center of the Fresnel zone’s ellipse. Figure 1a shows a simple seismic array with one source (red filled square) and seventeen receivers (blue filled circles). These simple theoretical plots show that the elongated elliptical shape of Fresnel zone is more pronounced at longer-offsets and shallower depths. Figures 1b-1d show the corresponding Fresnel zone binning for the array shown in Figure 1a at the depths of 50, 250, and 450m, respectively. The frequency of 50 Hz and velocity of 4000 m/s are used for the plots in Figures 1b-1d. The red color on the Fresnel zone plot represents the peak value of one and the blue color represents zero.
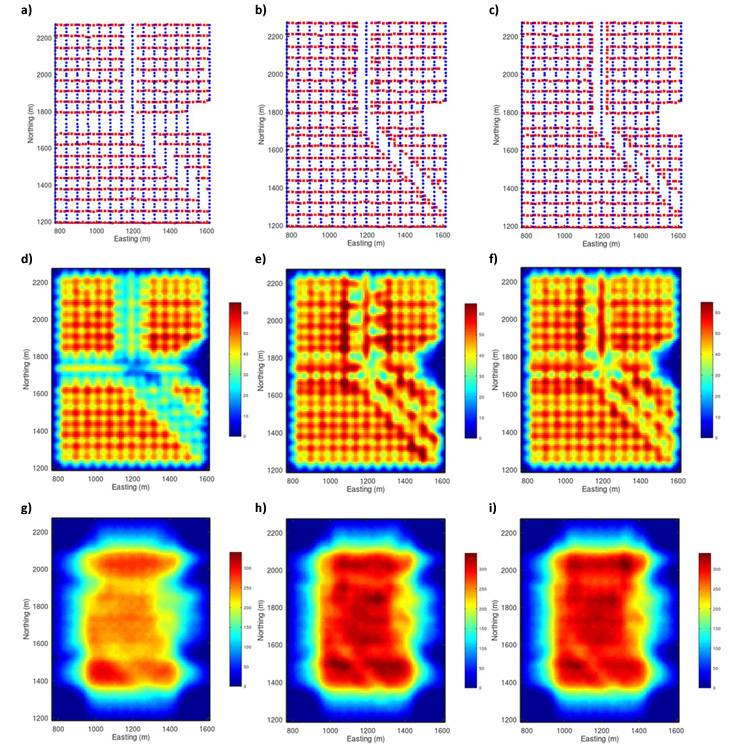
In order to utilize the Fresnel zone concept for seismic survey design analysis, first we generate the Fresnel fold map by summing the Fresnel zone responses from all pairs of sources and receivers in the survey at specific frequency, offset-range, depth and velocity. Here, we have investigated the Fresnel fold map by introducing an exclusion zone in an orthogonal real seismic survey (Figure 2a). We have used two strategies to mitigate effects of the excluded shots: A) Skidding the excluded shots parallel to shot-lines (Figure 3b) and B) Adding infill shots alongside the exclusion zones based on optimal station location predictions (Figure 3c). Figure 3d-3f show the Fresnel fold at 200 m depth and 100-150 m offset range for the surveys in Figures 3a-3c, respectively. Figure 3g-3i depict the Fresnel fold maps at 200 m depth and 400-450 m offset range for the surveys in Figures 3a-3c, respectively.
We introduce the relative standard deviation (𝑅𝑆𝐷) parameter to quantitatively measure the differences between the Fresnel fold maps, which is calculated by:
where, 𝜇 and 𝜎 are the mean and standard deviation of the elements of estimated Fresnel fold map, respectively. A smaller 𝑅𝑆𝐷 value indicates a more uniform distribution of the Fresnel zone coverage. The 𝑅𝑆𝐷 values for Figures 3d-3i were 28.8, 18.9, 17.7, 33.1, 34.0, and 33.7, respectively. These results indicate that for the shallow depths and short offsets both infill strategies A and B reduce the 𝑅𝑆𝐷 value significantly compared to the survey with exclusions and improve the uniform coverage of the subsurface target (Figures 3d-3f). However, the infill option B shows a slightly better performance than the option A with a lower, more uniform Fresnel fold.
For the long offsets and shallow depth (Figures 3g-3i), the 𝑅𝑆𝐷 values for both options A and B are similar indicating that the infill stations are more important for improving the near-offset data rather than the far-offsets. The above analyses can be carried out for any subsurface target of interest at the early stages of seismic acquisition design for finding optimal seismic station infilling strategies.
Conclusions
The limited-offset Fresnel zone formulation was used to generate Fresnel fold maps for different depths and offset ranges of 3D seismic surveys. We use the relative standard deviation (𝑅𝑆𝐷) as a quantitative measure to determine the uniformity of Fresnel fold maps. We aim to minimize the 𝑅𝑆𝐷 values after adding the infill stations to the surveys with exclusion zones. Our analysis show that infill stations are more important for improving the Fresnel zone coverage of short offsets. The effectiveness of various seismic infilling layouts can be quantified using the proposed 𝑅𝑆𝐷 parameter and it can also be used as a cost function for optimizing the position of infill stations.Acknowledgements
The authors would like to acknowledge Key Seismic Solutions Ltd. for processing the 3D datasets, and Alberta Innovates, NRC-IRAP, and other project collaborators for research funding contributions.References
Monk D. J., 2010, Fresnel-zone binning: Fresnel-zone shape with offset and velocity function: Geophysics, 75, P. T9T14.
Sheriff, R. E., 1980, Nomogram for Fresnel zone calculation: Geophysics, 45, 968–972.
Crook, A., 2016, Cost-Effective Seismic Exclusion Zone Mitigation Using Optimal Station Prediction (OSP) Method: The RECORDER, 33, no. 1, 32-36.
Millis, K., and Crook, A., 2012, The benefits of receiver infill stations: A technical case study: The RECORDER, 37, no. 7, 48-56.
Millis, K. and Crook, C., 2013, Optimal restriction modeling: A new approach to station positioning. SEG Technical Program Expanded Abstracts 2013: pp. 22-25.
Millis, K., Caulfield, C. and Crook, A., 2014, Optimal restriction modeling: The RECORDER, 39, no. 5, 22-27.