by Andrea Crook, Shane Bossaer, Cameron Crook, Alyson Birce, Stephanie Ross – OptiSeis™ Solutions Ltd.
Sean Contenti – Imperial
Megan Boutin, Frank Sun, and Kennedy Nwafor – Suncor Energy Inc.
Summary
In order to reduce the environmental impact of acquiring seismic surveys in the Canadian boreal forest, a reduction in line clearing is required. This can be accomplished by utilizing miniaturized seismic sources, but not all small sources provide sufficient energy for imaging deeper oil sands reservoirs. In the winter of 2020, two independent 2D field trials were conducted to test the use of a new, minimal impact seismic source for imaging both shallow and deep oil sands reservoirs. This case study presents results from this test and shows comparisons of the new minimal impact seismic source with conventional oil sands explosive sources.
Introduction
Seismic acquisition exploration in the Canadian Oil Sands is typically conducted in boreal forest. As a result, most oil sands seismic surveys require the cutting of seismic lines. Although the use of modern low impact seismic (LIS) methods, which utilize narrow mulched lines ranging in width from 1.75 m to 3.75 m, has reduced the environmental impact of cut lines relative to older methods, there is concern that regrowth of vegetation on these LIS lines is not assured (Kansas et. al., 2015). Although there is a desire to utilize smaller line widths, often, the width of a source line is predetermined based on the width of the source deployment equipment, such as with a miniVibroseis source where a cut line 2.75 m wide is required. In order to reduce the width of seismic cut lines, source equipment needs to be modified and miniaturized so that it can be rapidly deployed on narrower, minimal-cut lines (Larson et. al., 2020).
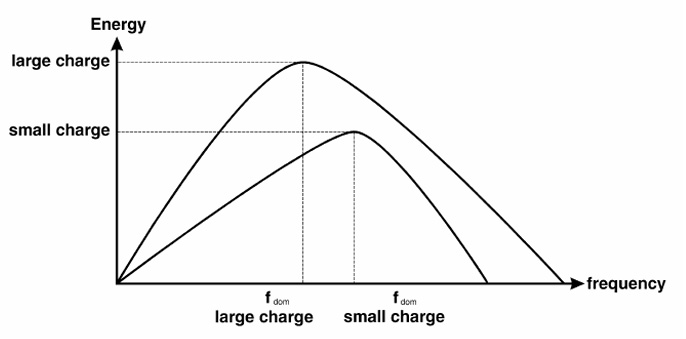
Figure 1: A theoretical comparison of a small explosive charge with a large explosive charge. From Cordsen et. al., 2000.
Method
During the winter seismic season of 2019/2020, two independent field trials were conducted. These were designed to compare a conventional an explosive source with the Orica Osx™ ClearWave™ source, which is a small, minimal impact explosive source (Fig. 2). This source has a directional, shaped charge that generates a near-planar shock wave for more efficient energy transmission. The goal of these trials was to determine if miniaturized seismic sources that can be deployed on minimal-cut seismic lines (width of 1.75 m or less) would provide sufficient resolution for imaging oil sands reservoirs.
Results from both these field trials were processed using the same processing flow. This workflow involved both conventional post-stack processing and AVOcompliant pre-stack processing. The conventional explosive source datasets and the ClearWave datasets were processed completely independent of each other. However, for “imaging” based comparison purposes, alignment statics were applied.
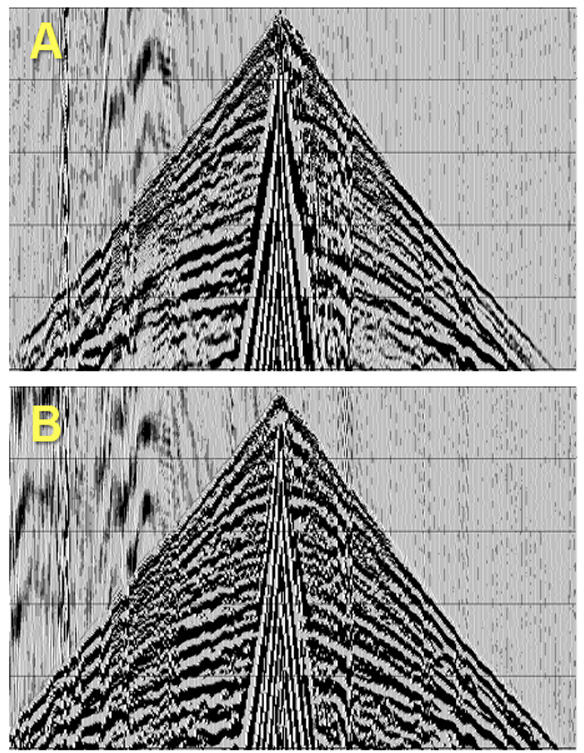
Figure 2: A comparison of the Orica Osx™ ClearWave™ source (A) and a conventional Dynamite source (B). Shot records are normalized to the same amplitude.
Examples
In Field Trial 1, a 2.5 km long section of a 2D line was utilized for the test. The test line was acquired across an active SAGD well pad and a shallow Quaternary channel. Seismic target depths ranged from 150 to 350m. Single sensor, three component geophones, were deployed at 5 m along the line. The conventional explosive source was a 125 g dynamite charge at a depth of 6 m with a source station interval of 15 m, and the ClearWave source was deployed every 2.5 m at depth of 1 m, which enabled decimation testing. In addition to the 2D line test, depth and pattern tests were conducted at three locations on the line.
Field Trial 2 was acquired as a short 2D line within a conventional 3D seismic program in an area with good data quality. The total line length was 1 km with 7 m source and receiver station intervals. Receivers were deployed along the entire line length, but sources were only deployed for 500 m within the middle of the line. Similar geophones were deployed on this test, but the ClearWave source, which was deployed at a depth of 1 m, was compared with a 90 g Pentolite source deployed at 3 m.
Results
In general, the final processing results show no significant differences between the conventional explosive source datasets and the ClearWave datasets. Although the raw field shots for this source type had higher amplitude groundroll and overall lower energy, the noise was easily removed in processing and the differences in amplitude were largely equalized by deconvolution. There was also more effort required to pick the first breaks, but the overall quality of the picks for each source type was the same. A comparison of the pentolite source in Field Trial 2 and the smaller ClearWave source is shown in Figure 3 along with a series of filter panels. Results are very similar in all frequency bandwidths.
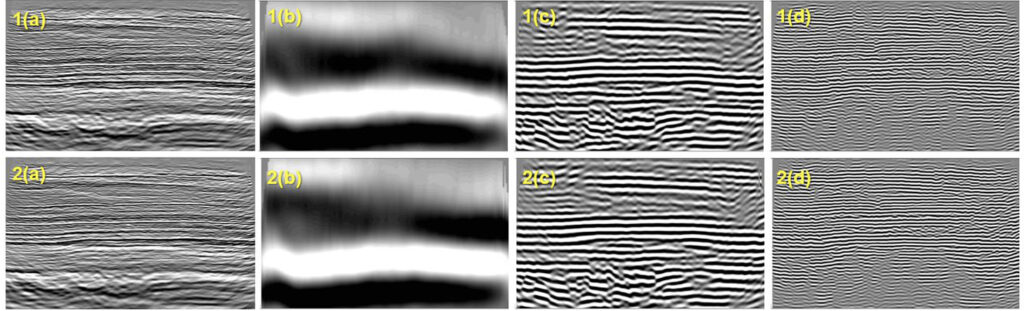
Figure 3: A comparison from Field Trial 2: the ClearWave source data (1) vs. Pentolite source data (2) illustrating the full section (a) and filter panels for 5-10 Hz (b), 60-90 Hz (c), and 150-200 Hz (d). Note the minimal difference in data quality in the various frequency bandwidths.
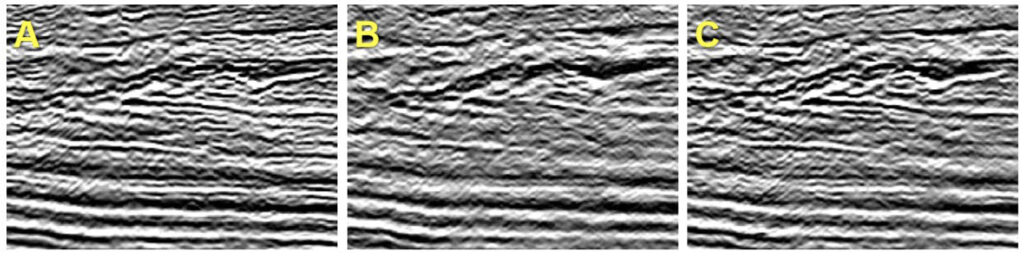
Figure 4: A comparison from Field Trial 1 illustrating the difference between (A) the fully sampled ClearWave dataset with 2.5 m source station interval, (B) the Dynamite dataset with 15 m source station interval, and (C) the decimated ClearWave dataset with a 15m source station interval.
Acknowledgements
The authors would like to acknowledge both Suncor Energy Inc. and Imperial for use of these datasets in researching the effectiveness of source miniaturization for oil sands seismic surveys, Key Seismic Solutions Ltd. for processing both 2D datasets, Orica for help with the preparation and implementation of the small source field trials, and Alberta Innovates for research funding contributions.
References
Cordsen, A., Galbraith, M. and Peirce. J. [2000] Planning Land 3-D Seismic Surveys. Society of Exploration Geophysicists, Tulsa.
Kansas, J.L., Charlebois, M.L., and Skatter, H.G. [2015] Vegetation recovery on low impact seismic lines in Alberta’s oil sands and visual obstruction of wolves (Canis lupus) and woodland caribou (Rangifer tarandus caribou). Canadian Journal of Wildlife Biology and Management, 4(2), 137–149.
Larson et. al. [2020] A Review of Exploration Tools and Techniques to Support the COSIA Land Challenge: Near Zero Footprint Seismic Exploration.