Seismic surveying is a method of creating pictures of the earth’s subsurface with recorded sound waves. Seismic can be used to help characterize any subsurface resource, including oil & gas, geothermal reservoirs, CO2 storage (CCS), ore bodies for mining of critical minerals, valuable brines (lithium), and more. Acquiring new seismic data on location (i.e., a ‘seismic program’) is a major capital investment for companies that develop these resources. Besides the program operator, there are other stakeholders like government regulators, local landowners, local indigenous peoples, and environmental groups who must all be considered when planning and carrying out a program. To satisfy the needs of all key stakeholders, we must use what we’ve learned from existing seismic data to design new exploration programs that derive the maximum benefit with the lowest possible impact and cost. We also need to demonstrate, even years later, adherence to all permits and conditions and our impact during field operations. Unfortunately, in current practice, often only a small subset of the data products generated by a seismic program has been archived. The meaning of ‘Seismic Data’ should be expanded beyond the records of the sound waves to include many other kinds of associated data.
Here we further explain what a land seismic program is, what files are generated through the seismic lifecycle and why it is important to preserve all types of seismic data for the future.
Seismic Method
Introduction
- Seismic is a key method for imaging and monitoring the subsurface
- Seismic involves laying out a set of sources to produce strong sound waves, and a set of receivers to record the vibrations
- Reflected sound energy is processed to generate an image of rock layers, similar to how sonar is used by animals and submarines, or how ultrasounds are used in medicine
- A ‘Source Point’ is a single sound wave source
- A ‘Receiver Point’ is a single vibration measurement station
Seismic Method
Survey Types
Seismic programs can be done in several modes:
2D Seismic
- Straight lines with source and receiver points along the same direction
- Result: Single 2D image of geology below the line of points on the surface
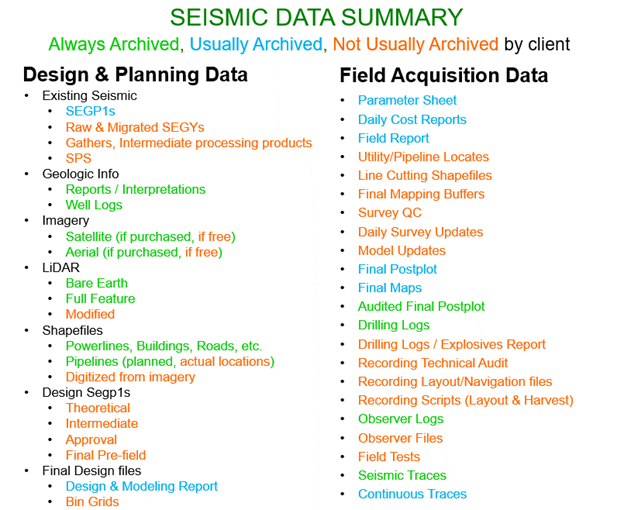
3D Seismic
- Arrangement of source points along source lines and receiver points along receiver lines to cover an area of the surface
- Result: Full 3D volume of geology below the layout of equipment on the surface
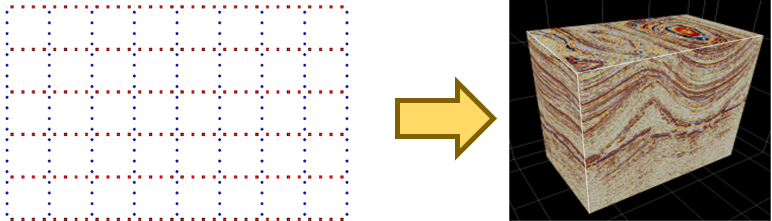
4D Seismic (time-lapse)
- Near-exact repeat of the same source and receiver positions as an earlier 3D seismic survey (baseline) – used after production to track changes over time
- Result: Difference between baseline survey and monitor survey, to highlight changes
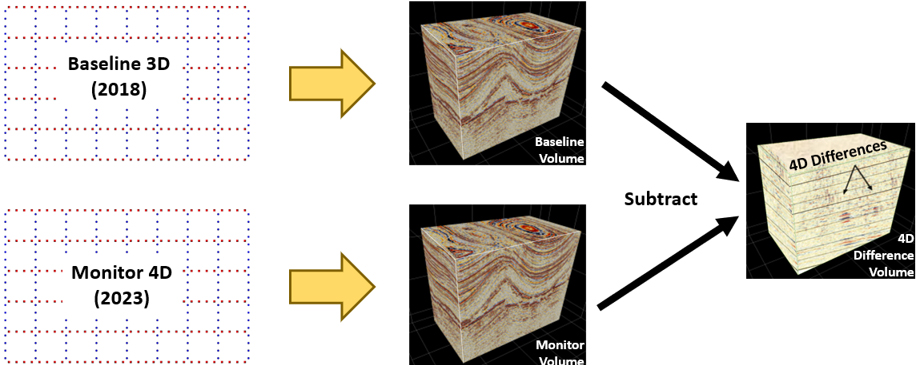
Vertical Seismic Profile
- This arrangement uses receivers deployed vertically in a well (geophones or distributed acoustic sensing (DAS) using optical fibers) with sources on the surface
- Result is a 2D or 3D cone-shaped image of geology surrounding the well
Seismic Programs
Equipment and Field Operations
Seismic programs can have many phases to allow the deployment of source and receiver equipment:
- Utility Locating
Like any project related to the subsurface, it is essential to locate pipelines, buried powerlines and other underground infrastructure. - Line clearing
Combination of mulchers and hand-cut (chainsaws) creates usable access trails for later phases. Crews are equipped with GPS devices to guide them and track the cutting locations (lines) – if this is not possible then they work alongside surveying crews who mark and identify the cutting locations. Clearing is not needed in the desert and minimally in farmland areas. - Surveying
Specialists with professional-grade GPS systems, who mark the individual point locations for later crews. Sometimes GPS-enabled source and receiver equipment can be used to eliminate the need for specialist crews to visit each point (stakeless). - Drilling (if explosive source points)
Small drilling units that create the boreholes for loading explosive charges – generally 10-60 ft depth (3-20m). In very rugged areas, drills can be lifted using helicopters, or power augers can be carried on foot.
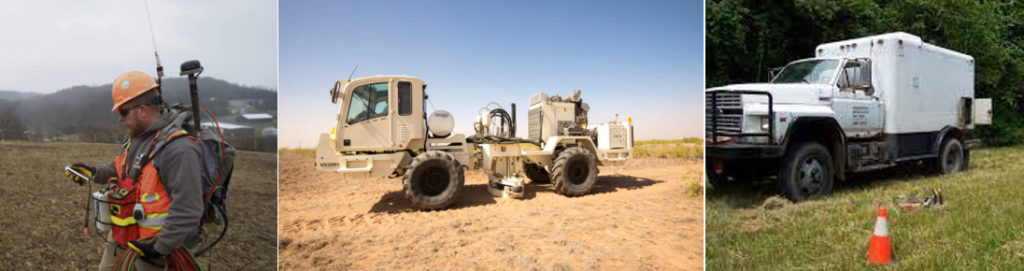
- Recording
A seismic recording crew may have 10-50 individuals, who lay out receiver equipment, initiate the source points, and generate the digital seismic traces. There are many roles within a recording crew.
- Layout Teams of 2-5 individuals carry recording equipment to receiver points and plant vibration sensors (geophones) in the ground. Most systems today record and store the vibration data at each receiver point continuously.
- Sources (Shooting) Once enough geophones are laid out, other crew members start initiating the source points one at a time, either by detonation of explosives or activating Vibroseis equipment. Source activation is initiated over radio from a source control unit (doghouse), by a crew member called the ‘Observer’.
- Pickup Recording equipment is picked up after all source points near that receiver are complete. For most modern systems, the continuous vibration records are downloaded from each receiver at a data management trailer, and the seismic traces are created by selecting the relevant time intervals based on source times in the Observers Log.
Data Flow in Seismic Survey Design
The design process determines how many source and receiver points and lines are needed to create a quality seismic image at the minimum cost. The survey design sets out how much work needs to be done, which is the largest impact on the cost.
Required Data
Many kinds of files are used as input to seismic survey design to optimize the planning:
- Target Information
Specifics of the rock layers to be imaged. For example, the depth below the surface, the maximum slope of structures underground, physical properties of rock formations, etc.- Data types: Text, Reports, Well Logs (LAS)
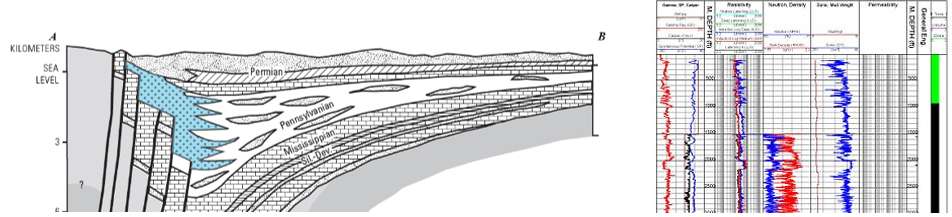
- Existing Seismic Data
Key information about what equipment and parameters have been used before, and whether the program has major challenges to overcome. This includes the broadest definition of ‘Seismic Data’, including seismic traces as well as all reports, parameter sheets and records of design choices. Accurate locations are needed to repeat any stations, either for 4D time-lapse or merging with an adjacent seismic image.- Data types: Reports, Logs, Spreadsheets, SEGP1 (positions), SPS (scripts), SEGY (raw, intermediate, and final processed traces, sections & velocity models), interpretations (horizons, inversions, data evaluations)
- Exclusions & Access
Features that must be avoided – like roads, waterbodies, powerlines, pipelines, well pads and buildings. Often by regulation there is a source exclusion buffer distance, and some areas like sensitive environmental zones lock out all access including receivers. Additional features like key access routes and temporary storage sites are needed to produce a practical design for field crews.- Data types: ESRI Shapefile, KML/KMZ, text (CSV), etc.
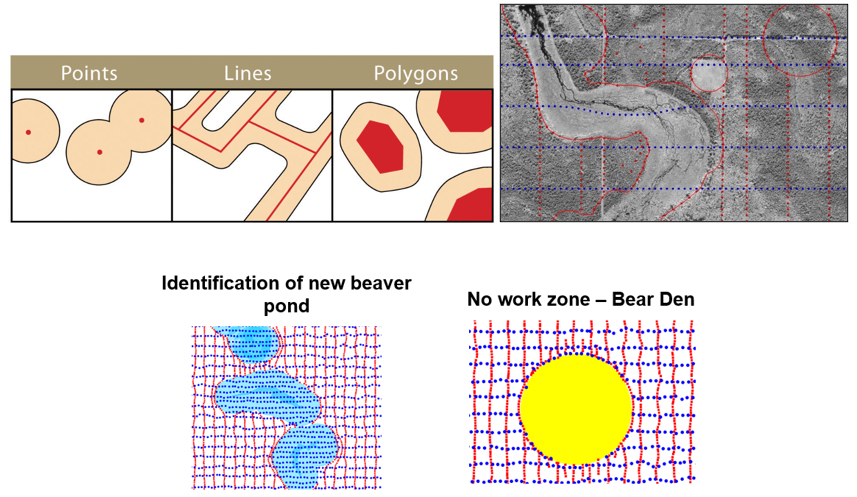
- Images / Grids
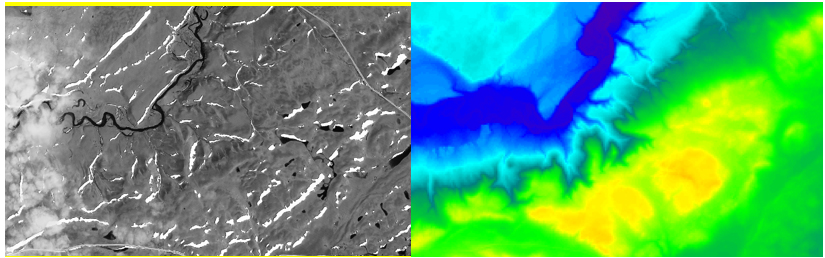
Satellite or aerial imagery (higher resolution is better) has become essential for context to the exclusions and access files. LiDAR is also very helpful to provide a detailed elevation map and important information about landforms, steep slopes, forest canopy, etc. that are difficult to interpret from visual images alone.- Data types: GeoTIFF, JPEG, GRD, XYZ, etc.
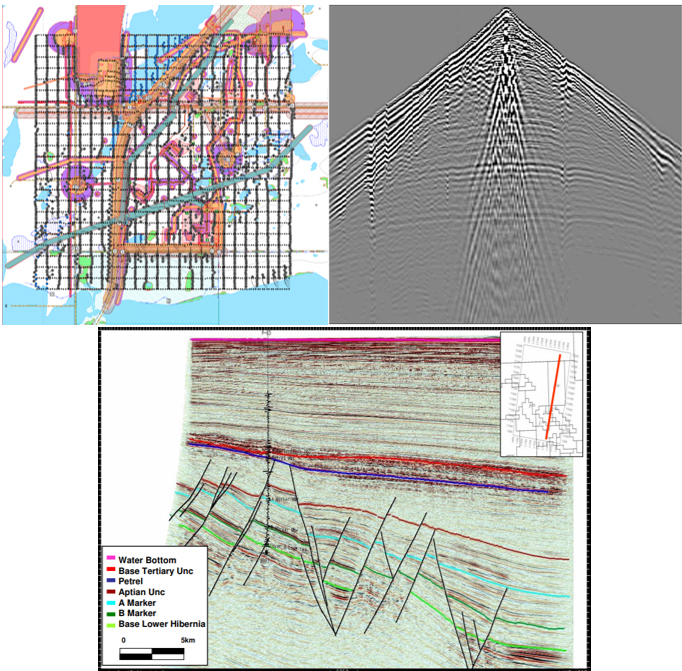
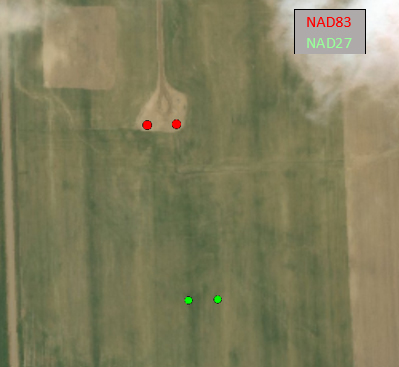
Information about the coordinate system (geodetic definition – datum & projection) for each file that stores mapping coordinates is essential to ensure coordinates are correct for the area and can be used by field personnel. Without accurate geodetic information, the positioning data (e.g. SEGP1, Shapefile, text coordinates, imagery) can range from confusing to useless. In the aerial photo below, Red & green circles represent the location of the same wells according to different coordinate systems. Errors in coordinate systems can be found using imagery if the coordinate system of the imagery is known.
Seismic Survey Design Output
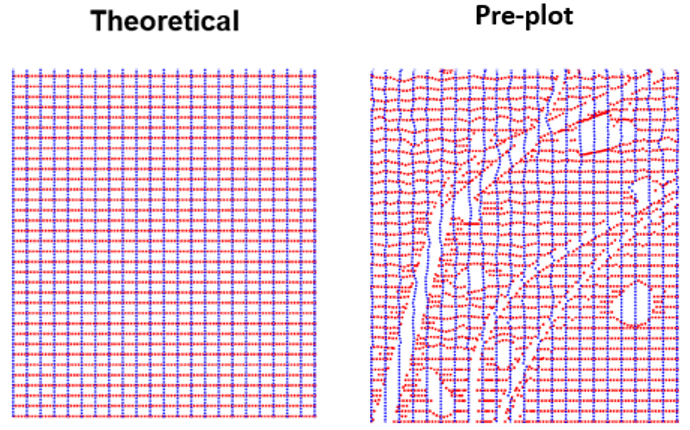
Once the required data has been assembled, professional geophysicists will go through a process of determining sampling and data density requirements, resulting in a theoretical layout. Then they adjust around them utilizing exclusion, access, and imagery files, and create files for the initial program map, called the ‘Pre-plot’.
These maps show a standard 3D design, which requires a uniform density of lines appropriate to make the full 3D image at the target depth. A 2D seismic program map is similarly impacted by obstructions, but has far fewer lines.
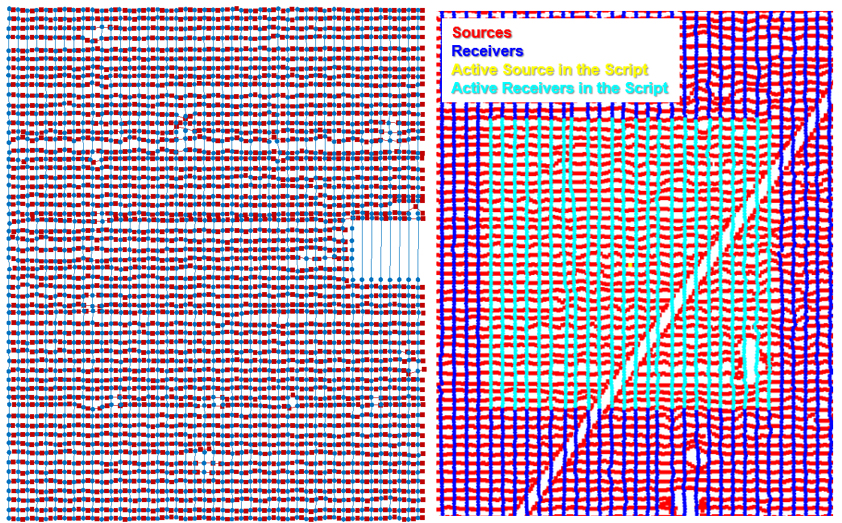
The maps are optimized based on an imaginary grid that represents the sampling needed to produce the desired image, called a bin grid. From the hundreds or thousands of source and receiver points, each source-receiver pair is represented by one dot on the bin grid. The same concept is essential when processing the data, and it can be helpful to start with the bin grid used in designing and optimizing the seismic survey. The design bin grid is very difficult to determine later if it was not stored.
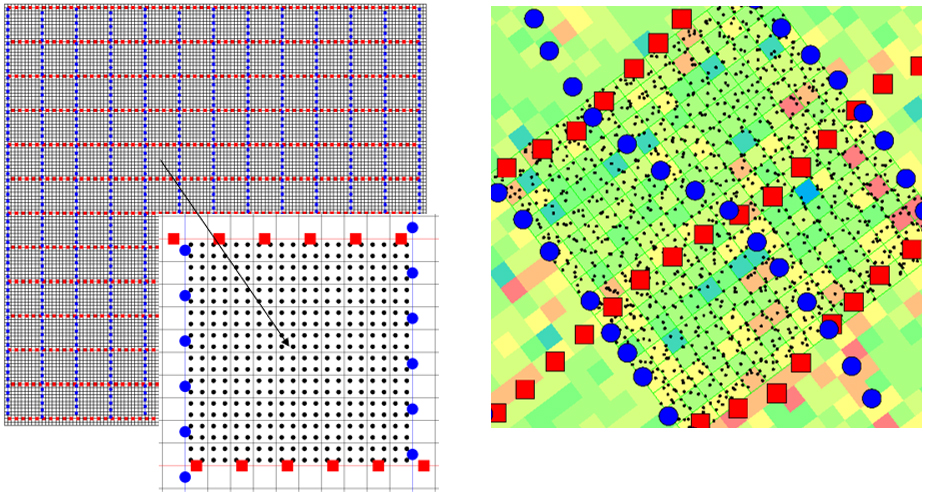
Fig 2.3.3: Bin Grids. Left: Theoretical design, right: Final design (fold plot)
Survey Design Outputs
- SEGP1 Pre-plot: Contains Source and Receiver positions optimized to account for all exclusions. Generally, one file for sources, and separate one for receivers. The final exclusion files (shapefiles) are also provided to field crews to start their work. This is usually not the end of the design process, which overlaps with field operations. As new obstructions and constraints are discovered in the field, this is fed back to the survey designer for ‘remodeling’, which is exported as a new SEGP1.
- SPS Recording Scripts: Once the source and receiver point positions are final, the last output is a set of text files for recording. This includes a file for source and receiver position (similar to SEGP1) and a ‘relational’ file that defines which receivers were live for each source. Together these 3 files are called SPS Scripts.
Survey Design Report
Description and justification of design decisions based on the area, budget, and the target information. Summary of final spacings, parameters and bin grid.
Data Generated During Seismic Program
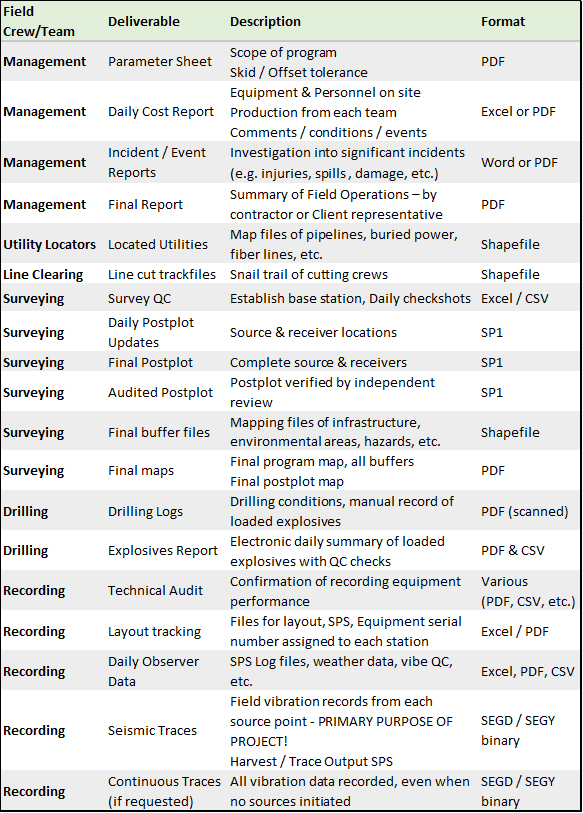
Once the crew arrives on site and begins work on the seismic program, new data and reports arrive daily. The field crews generate a large volume of data products, summarized in Table 1:
Recommendations